

![]()

![]()


![]()
![]()

![]()
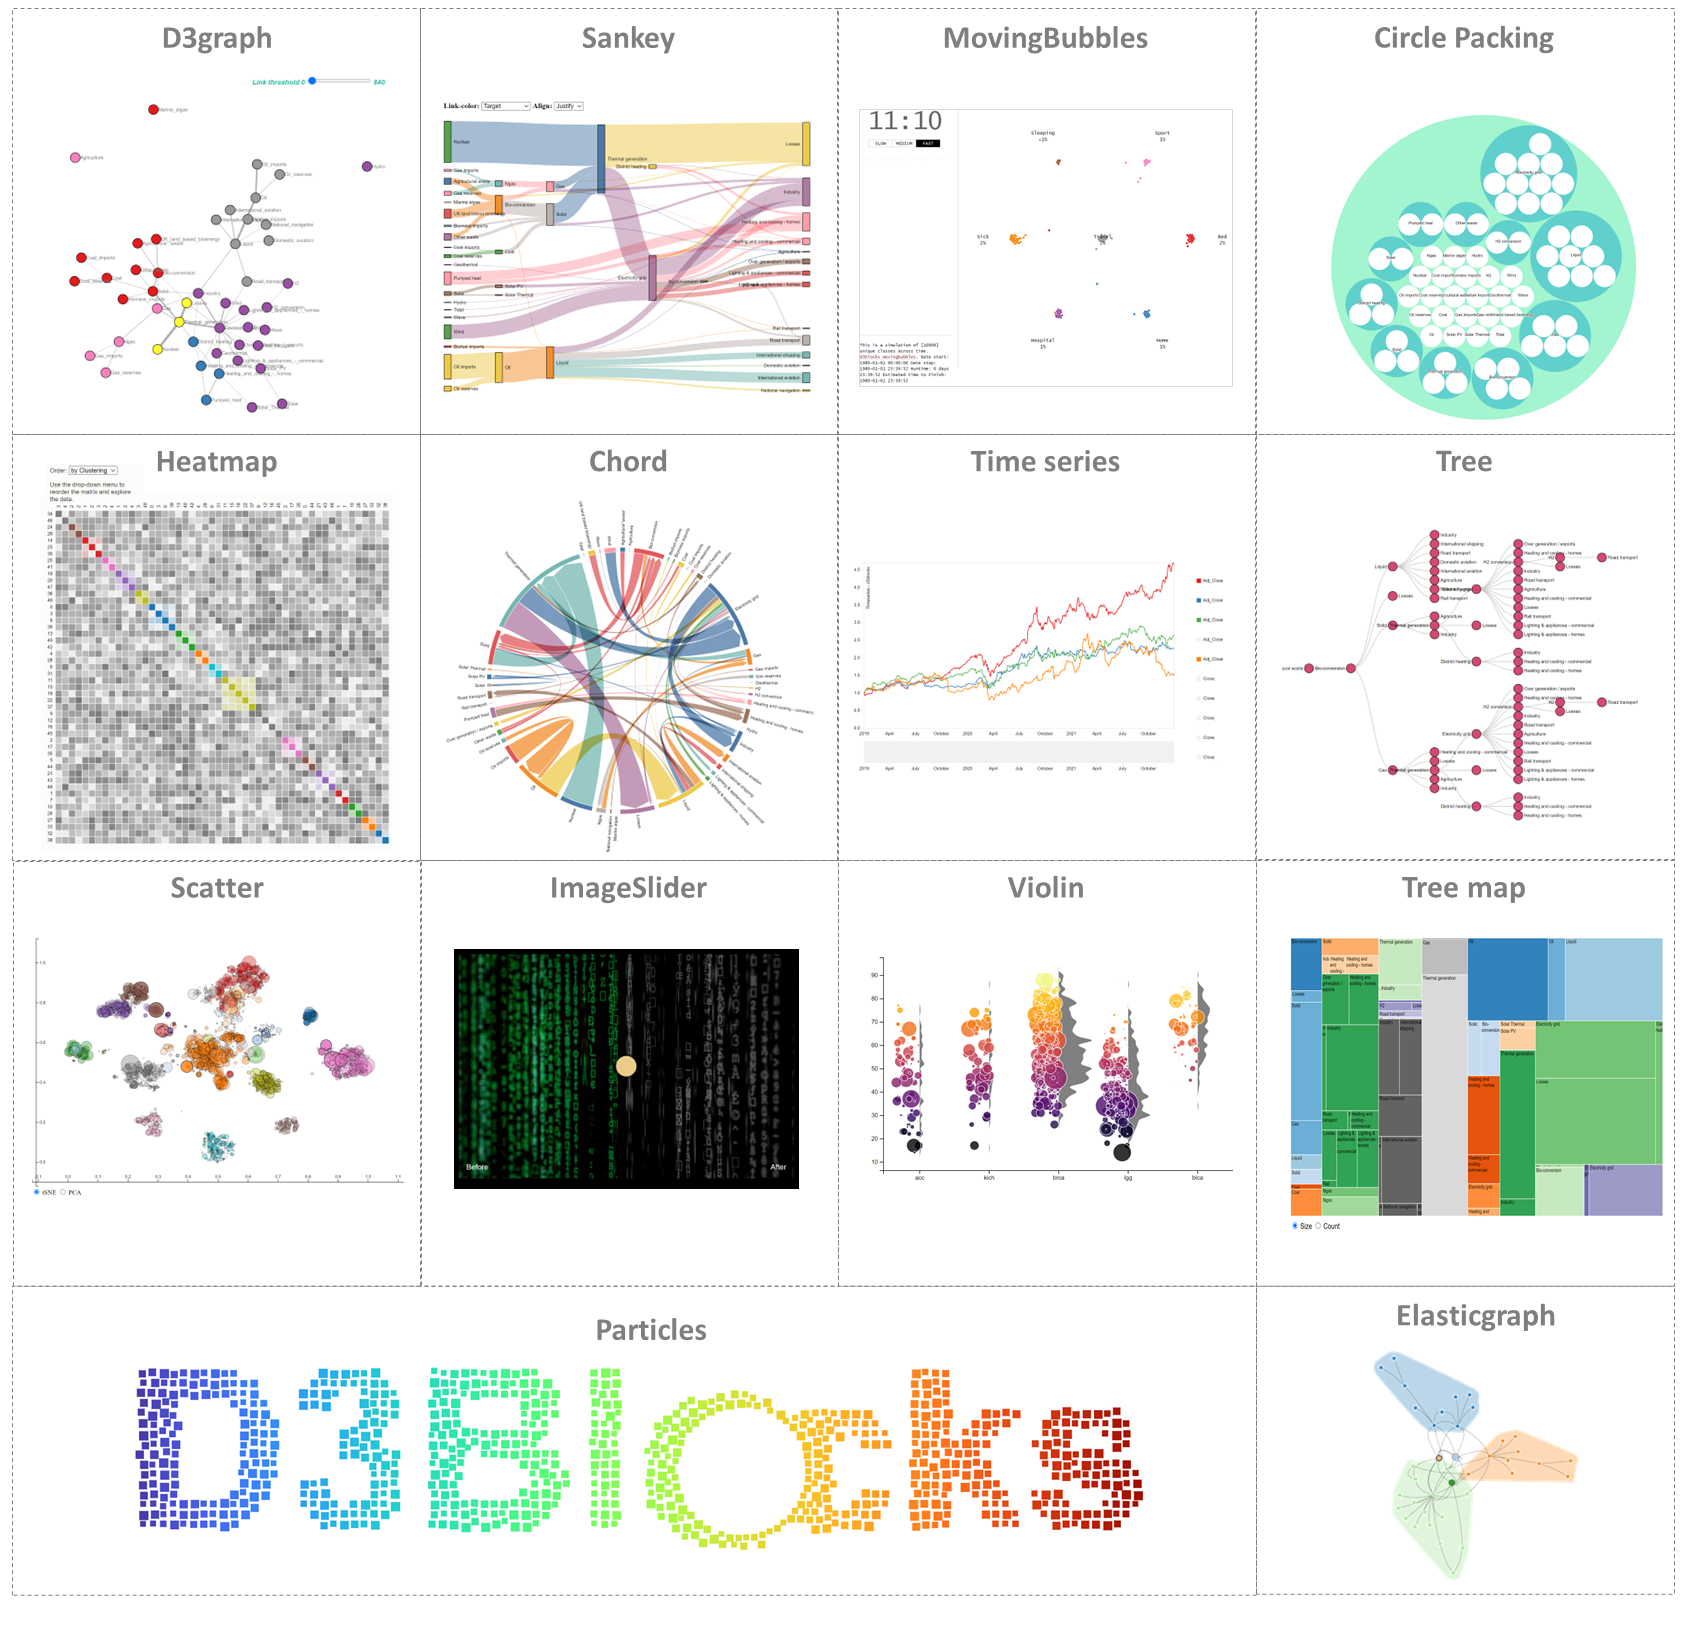
D3Blocks builds on the graphics of D3 Javascript to create the most visually attractive and useful charts with only a few lines of Python code.
|
Note
Your ❤️ is important to keep maintaining this package. You can support in various ways, have a look at the sponser page. Report bugs, issues and feature extensions at github page.
pip install d3blocks
More detailed and structured story line about the charts can be found in the blogs*
Contents
Motivation
Blocks
Helper functions